
Rz vs Rt compares different height quantities in a profile roughness report. In the older ISO 4287 context discussed below, an averaged set of section heights and the highest-to-lowest span across the evaluation length can give different values.
Keep the parameter name and governing specification beside the number. Then identify the evaluated surface and reporting conditions before deciding whether the report answers your drawing.
Follow the calculation and review
1. Read Rz vs Rt in the named standard context
Digital Surf’s ISO 4287 parameter guide defines Rt as the height from the deepest valley to the highest peak over the evaluation length. It places Rz’s maximum profile-height definition within a sampling length.
Mahr’s 2017 explanation describes reported mean roughness depth Rz as the arithmetic average of the individual section depths Rzi. Each individual depth spans its section’s highest peak and deepest valley.
These descriptions establish the context for the original example below. They do not specify the complete measurement and acceptance procedure for an unidentified part.
Keep an older drawing’s context visible
Mahr’s 2022 explanation of ISO 21920 describes the updated profile-standard series and its changed terminology. It also distinguishes new drawings from older dated drawings retaining their previous standard basis.
For purchasing, preserve the drawing’s stated specification and edition. Ask the responsible engineering and quality teams to resolve the intended basis when it is unclear.
Do not relabel a report from one basis as another without that review. Keep any accepted change identifiable in the controlled drawing and inspection requirement.

2. Follow an original five-section example
Imagine five consecutive sections of one fictional roughness profile. For this arithmetic illustration, all peak heights and valley depths use the same mean-line reference and are expressed in micrometres.
The invented section heights are 4, 6, 6, 6 and 5 µm. Their average is (4 + 6 + 6 + 6 + 5) / 5 = 5.4 µm.
Across the same fictional profile, the highest peak is +5 µm and the deepest valley is −4 µm. Their vertical span is 5 − (−4) = 9 µm. The two extremes occur in different sections.
| Section | Peak / valley | Span |
|---|---|---|
| A | +3 / −1 | 4 |
| B | +4 / −2 | 6 |
| C | +2 / −4 | 6 |
| D | +5 / −1 | 6 |
| E | +3 / −2 | 5 |
In the stated older context, the section-average calculation illustrates reported Rz, while the overall span illustrates Rt. The results differ because the calculations retain different height information.
This is an original arithmetic illustration. It is not an instrument trace, a simulated manufacturing result, a certified evaluation or a recommended acceptance limit. Actual measurement requires the applicable method and reporting conditions.
Why the biggest section span is another entry
In the invented table, the largest individual span is 6 µm. It is neither the 5.4 µm average nor the 9 µm whole-profile span.
The example makes one purchasing error easy to spot: selecting the largest local entry is not the same arithmetic as selecting the global extremes. Preserve the evaluator’s parameter label instead of renaming either result.
A different invented profile could give different relationships between those entries. This table supplies no conversion factor for a real aluminum surface.
The Ra and Sa guide covers the separate line-versus-area question. Here the comparison concerns two height summaries within the identified profile context.
3. Keep the report’s identity and conditions together
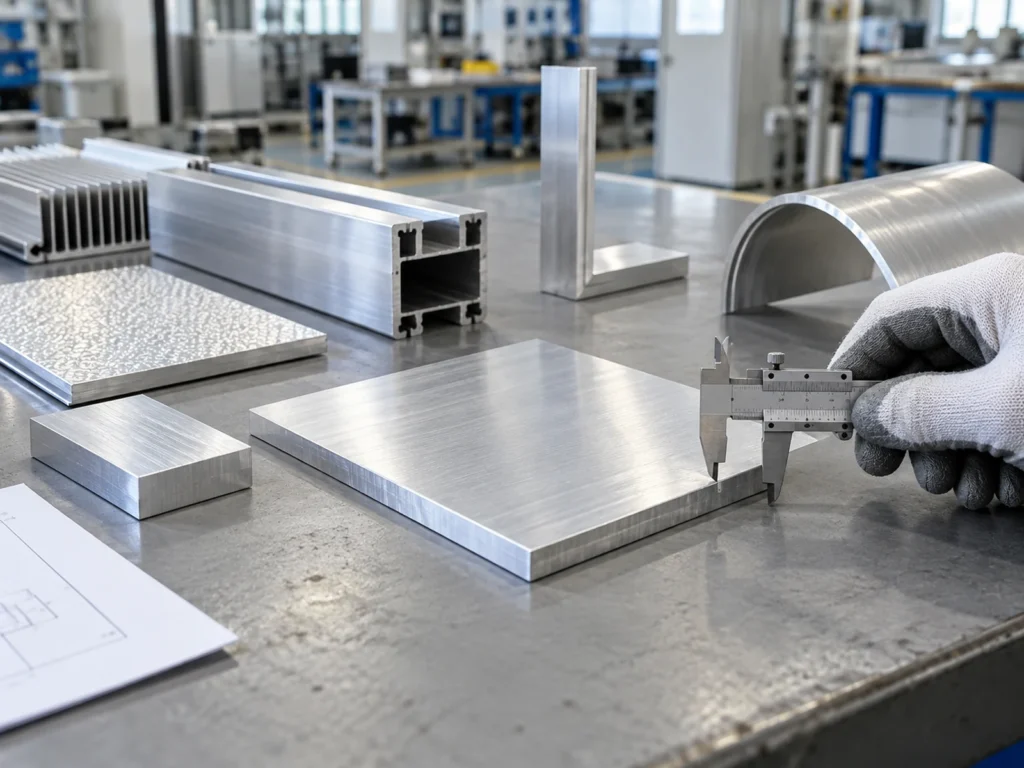
Mark the actual surface on the component drawing. Identify the processing stage represented by the report, such as the supplied cut face or a later machined face.
Retain the evaluated path and direction under the approved inspection plan. A result for the stock’s long surface does not identify the condition of its newly cut end.
Keep the reported parameter, unit and specification together. Preserve the evaluator’s measurement and filtering information rather than transferring a bare number to a quotation column.
Ask the evaluator to identify the relevant profile and evaluation lengths when those fields are needed to interpret the report. Use the applicable method to determine the required details.
The cut-surface roughness RFQ guide organizes the wider request. It also separates texture, edge condition, geometry and visible appearance into their own questions.
A readable record for each sample
- Sample identity and drawing revision.
- Marked surface and represented processing stage.
- Parameter, unit and applicable specification.
- Reported evaluation conditions and result.
- Decision under the agreed acceptance requirement.
Keep individual sample results connected to those fields. A summary can help compare submissions, provided the underlying records remain identifiable.
If the report’s quantity differs from the requested one, label that field as unresolved. Refer the proposed change to the responsible reviewer or request the required evaluation.
Resolve a missing result with a focused request
Please provide the specified roughness parameter for the marked surface. Retain the applicable standard, evaluated path, reporting conditions and units. Identify any proposed change from the released drawing separately.
Add the part number, revision and sample identity. State which entry is missing so the laboratory or supplier can answer the actual question.
When the answer arrives, retain it with the original report. Update the acceptance record to show what was clarified and which evidence now supports the decision.

Bring the requirement into the cutting discussion
Send JiurunCut the marked cut-face drawing and sample requirements. Include the specified parameter, units, material section and processing stage to be evaluated.
For an Rz vs Rt question, attach the original callout and available report. That lets the review identify a missing quantity without changing the customer’s requirement silently.
Can a photograph establish either numerical result?
A location image helps identify the face. Obtain the required texture evaluation for its numerical result.
Does this example select a roughness limit?
Use the actual component drawing and approved acceptance requirement.